In many ways, 2020 was an uninvited guest who overstayed their welcome into 2021. Three previous fiscal quarters of widespread lockdowns and hiding from COVID gave way to a year of adaptation for the global direct selling industry.
Direct sellers across the globe emerged into the sunlight to face ever-changing, mid-pandemic operational environments and in some markets, post-pandemic business climates that brought fairly large swings in sales performance—some for the better and some for the worse.
Health-related COVID concerns, supply chain disruptions, manufacturing shortages, stalled shipments, ever-increasing costs—these were industry-wide hurdles faced everywhere, but not necessarily everywhere at the same time. That depended upon local government priorities, which ranged from moving swiftly to re-open economies to further lockdowns in order to beat the virus, which in turn continued economic pressure.
This forms the context around which the World Federation of Direct Selling Associations conducted its 2021 global sales survey. This cooperative survey reveals an annual snapshot of an entire year’s direct selling activity across the world, in one set of figures, submitted by local DSA member companies. Then compiled by the DSA to reflect country sales performance, it is later extrapolated into regional and global sales data. In some instances where DSAs do not exist or lack staffing, WFDSA’s CEO Council plays an advisory role in estimating market sales.
WFDSA’s report, announced earlier this summer and valid through May 2023, shows slim global industry expansion made up of some fairly big gains and losses, which Global Research Subcommittee Co-Chair Tim Sanson believes was reflective of the social and political approach to the pandemic.
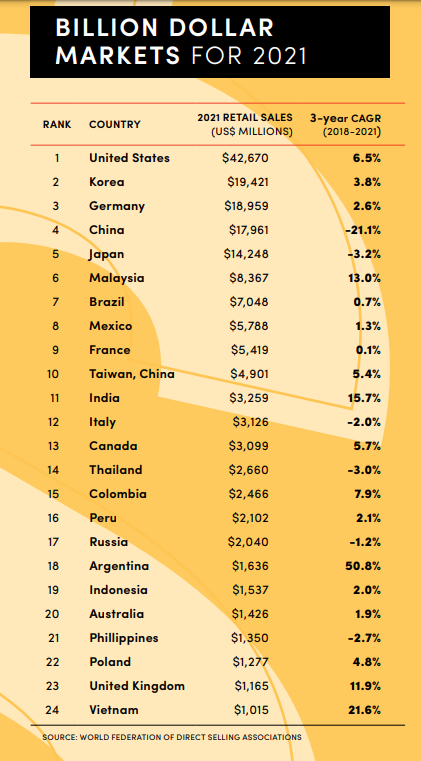
It is in those gains and even those losses that Direct Selling News constructs its 2021 list of Billion Dollar Markets, which expanded this year to a total of 24 with the addition of Vietnam. WFDSA data shows that 78 percent of global sales production comes from the top ten global markets, of which the United States sits atop.
The Data
Note: All WFDSA data have been rounded throughout.
WFDSA reports global estimated retail sales of $186.1 billion (Constant U.S. Dollars) for 2021, an increase of 1.5 percent over 2020.
This figure includes data from the China market; however, due to its sheer size, lack of transparency and continued COVID struggles, WFDSA opted to announce dual figures—with and without China—to make visible the effects this market has on regional and global data.
Therefore, excluding China, global estimated retail sales for 2021 were $168.1 billion with a three-year compound annual growth rate (CAGR) of 3.8 percent for the period 2018-2021.
Regional sales performance was a mixed bag in 2021. Estimated retail sales in The Americas was up 5.8 percent and Europe gained 2.8 percent. However, Asia/Pacific was impacted by significant losses in China, its largest market, and reported regional losses of 2.2 percent as a result. Emerging markets in Africa/Middle East reported losses of 10 percent.
Global industry growth, measured by the 3-year CAGR indicates a static atmosphere for the 2018-2021 period.
Significant positional shifting within DSN’s Billion Dollar Markets list took place this year, most notably the fall of China to fourth position as a result of compounded multi-year losses, and the subsequent rise of Korea to number two. Overall, the Asia/Pacific Billion Dollar Markets struggled, as Japan, Indonesia, Australia, the Philippines and Thailand all suffered losses. However, the picture in the Americas and Europe was significantly brighter as every Billion Dollar Market, with the exception of Brazil and Russia, gained ground.
Of the 24 Billion Dollar Markets, the United States leads global retail sales at 23 percent, followed by Korea, 10 percent; Germany, 10 percent; China, 10 percent; Japan, 8 percent; Malaysia, 4 percent; Brazil, 4 percent; Mexico, 3 percent; France, 3 percent; and Taiwan, China 3 percent. All other reporting markets comprise the remaining 22 percent of global sales.
128.2 million independent representatives participated in direct selling worldwide in 2021. These independent representatives affiliate with a direct selling company but enjoy the freedom of building a business on their own terms and time.
Many join because they love the company’s products or services and want to purchase them at a discount. Forty percent of global markets reported active preferred customer programs in 2021, consistent with 2020’s statistic. Still others work either full- or part-time to earn supplemental income. The most successful of these sponsor other independent representatives and mentor them into building successful businesses, too.
/ AMERICA /
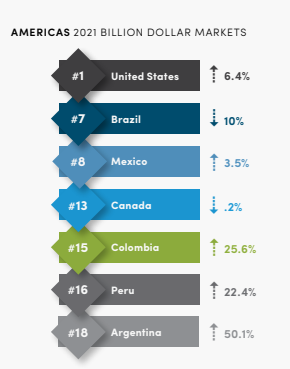
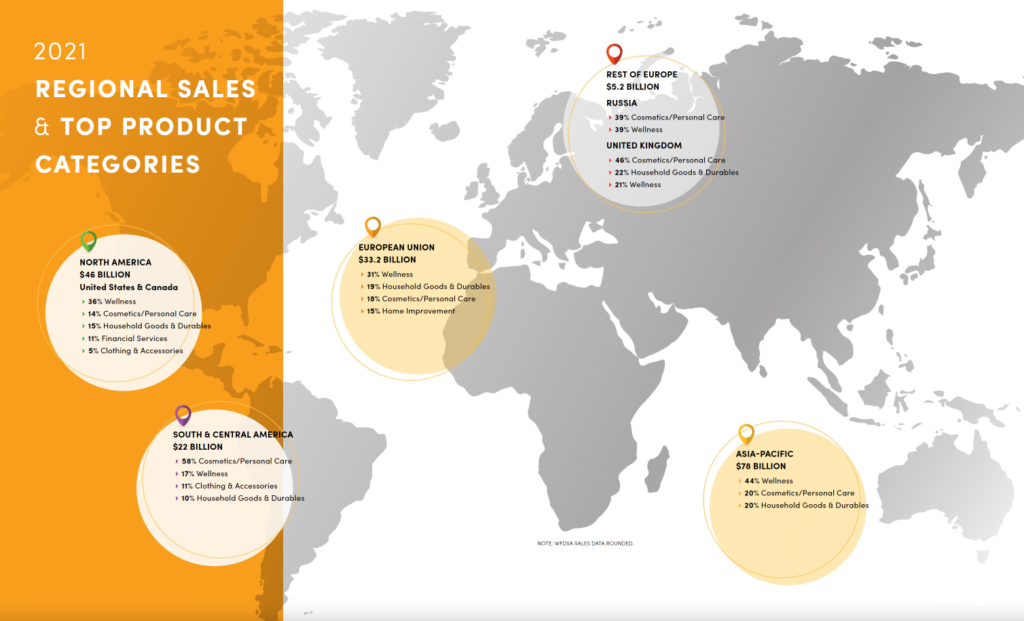
The Americas—North and South/Central—combined to post $68 billion in estimated retail sales in 2021—36 percent of direct selling’s global market sales. This was an increase of 5.8 percent and resulted in a three-year CAGR of 5.4 percent.
There were seven Billion Dollar Markets within the North and South/Central America region for 2021, duplicating 2020. A surge in Wellness product popularity has for the second year ranked number one at 30 percent. Cosmetics comprised 28 percent with Household Goods and Durables a distant third at 13 percent for the second year. The number of independent representatives in the Americas essentially ran even in 2021 at 32.4 million, but showed a gain of some 3.6 million representatives since 2018.
Regional data for the Americas reported together; however, the Americas are split here to better understand each of the distinct markets.
North America
On the heels of a pandemic-related sales spike of 14.7 percent in 2020, the North America market continued its expansion in 2021, reporting $46 billion in sales and year-over-year growth of 5.9 percent, even as the industry began an expected post-pandemic normalization.
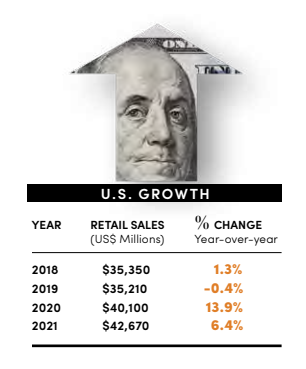
The United States’ 23 percent share of worldwide sales for 2021 was once again a reminder of its global industry dominance. The U.S. market quickly normalized conducting business amid a pandemic during 2020 and further sorted out any remaining kinks last year to generate $42.6 billion in sales in 2021, growth of 6.4 percent year-over-year and a 3-year CAGR of 6.5 percent.
The 26 percent sales growth registered by Canada in 2020 slipped in 2021 to -0.2 percent, yet generated estimated retail sales of $3.3 billion, increasing 3-year CAGR to 5.7 percent.
Wellness products were by far the most popular in North America garnering 36 percent of all industry estimated retail sales in 2021. Household Goods and Durables ranked second at 15 percent and Cosmetics third at 14 percent.
Independent representative numbers for North America fell by more than 600,000 in 2021, which returned this statistic to 2019, pre-pandemic levels. 16.2 million independent representatives resided in the United States—nearly a half million fewer than 2020—and the remaining 1.3 million called Canada home.
South/Central America
Brazil, Mexico, Colombia, Peru and Argentina comprise the South/Central America region. Their sales performances in 2021 produced astounding country market expansions, a rally to overcome previous year losses, as well as typical incremental increases and regional disappointments.
Argentina’s notable 90.3 percent 2020 sales growth was followed in 2021 by a 50.1 percent increase, expanding this market’s CAGR to 50.8 percent. While it’s important to note the highly inflationary aspects of Argentina’s market, these increases continue to stand out.
Colombia also experienced significant expansion as they added nearly half a billion in sales, which equaled a 25.6 percent year-over-year increase. Peru, another of 2021’s sales winners, rallied after a 2020 downturn to mark a 22.4 percent increase in sales over the previous year, which bounced their CAGR into positive territory at 2.1 percent.
Brazil, however, experienced a sizeable downturn in sales performance in 2021, losing nearly $800 million in sales. That’s a market loss of 10 percent year-over-year.

Regionally, estimated retail sales for South/Central America were up 5.6 percent, reporting in at $22 billion in 2021 with a CAGR of 3.5 percent.
Individual country market statistics are: Brazil ($7.0 billion, 3.8 percent of global market, 0.7 percent CAGR), Mexico ($5.8 billion, 3.1 percent of global market, 1.3 percent CAGR), Colombia ($2.5 billion, 1.3 percent of global market, 7.9 percent CAGR), Peru ($2.1 billion, 1.1 percent of global market, 2.1 percent CAGR), and Argentina ($1.6 billion, 0.9 percent of global market, 50.8 percent CAGR). Inflationary economies like Argentina typically report restated data later in the year.
Cosmetics and Personal Care products once again dominated regional sales at 58 percent but continued trending slowly downward since 2017’s 67 percent high. Wellness ranked second at 17 percent, while Clothing and Accessories slotted third at 11 percent. After a 2020 surge in recruitment that saw 14.4 million independent representatives, 2021’s figures once again increased to 14.9 million.
/ ASIA PACIFIC /
The Asia/Pacific region—comprised of 10 Billion Dollar Markets—generated 42 percent of global retail sales in 2021. Estimated retail sales of $77.9 billion in 2021, a decrease of 2.2 percent, marked the fourth consecutive regional sales constriction for a market that boasted 48.7 percent of global retail sales in 2018. The Asia/Pacific region’s three-year CAGR stands at -5.0 percent in 2021.
Nearly 74.5 million independent direct sellers represented products and services in the Asia/Pacific region, a 2.6 percent increase over 2020 and accounted for more than 58 percent of all direct sellers in the world. The Wellness product category captured 44 percent of the market with Household Goods and Durables, as well as Cosmetics and Personal Care tied at 20 percent.
It is vital to note the impact China has on Asia/Pacific’s regional statistics. China is the largest and most influential Asia-Pacific market, but various economic and regulatory conditions were made worse by COVID and the market’s difficulty rebounding from pandemic.
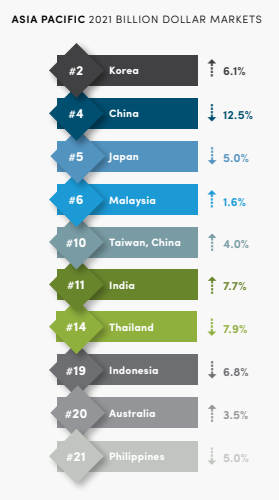
China’s sales fell in 2021 for the third straight year, down 12.5 percent. Their estimated retail sales stood at $18 billion, down from $37 billion in 2018. Their positioning as a consistent second place in the overall Billion Dollar Markets rankings slipped to number four and their CAGR sharply declined, posting in at -21.2 percent. Similarly, independent representative numbers fell for the fourth straight year to 3.1 million.
The Asia/Pacific region feels reverberations from anything that takes place in the China market. To get an insider’s look and improve the consistency and confidence in this market’s data collection, WFDSA worked with the Direct Selling Research Center at Peking University for a third year.
Perhaps, the biggest news out of the Asia/Pacific region was the addition of Vietnam to the Billion Dollar Markets list. While the Vietnam market accounted for only 0.5 percent of the global market, the direct selling industry has incubated there and estimated retail sales nearly doubled since 2018. Four consecutive years of double-digit growth culminated in hitting the $1 billion mark in 2021 and reporting a CAGR of 21.6 percent.
Vietnam joins the ranks of nine other Asia/Pacific countries on the Billion Dollar Markets list for 2021. The enormity of the Asia/Pacific market results in volatility due to the intricacies, personalities and environments of each country market. The impacts of COVID only accentuated this regional market characteristic.
As direct selling lost momentum in China, causing it to slip in its Billion Dollar ranking, the Korea market saw a sharp 6.1 percent rise in sales, generating $19.4 billion in sales for 2021, which elevated them to the number two spot. While growth in the India market slowed after a 28.3 percent increase year-over-year in 2020, their 2021 7.7 percent growth represented a fourth consecutive year of market expansion. The Australian market reported its second year of growth in 2021, posting 3.5 percent year-over-year change and rebounding CAGR of 1.9 percent after three years in the negative space. Taiwan-China did not experience the same market constriction as mainland China. In fact, the Taiwan market grew by 4.0 percent over 2020 and indicated a 5.4 percent CAGR.
There were, however, several struggling markets in the Asia/Pacific region. Japan’s slide continues for a third year, as estimated retail sales dropped 5.0 percent and their CAGR dipped to a low of -3.2 percent. The Philippines and Thailand experienced similar losses, as did Indonesia—all dropping between 5.0 and 7.9 percent in 2021.
Asia/Pacific Billion Dollar Markets data reports as follows: Australia ($1.4 billion, 0.8 percent of global market, 1.9 percent CAGR), China ($17.9 billion, 9.7 percent, -21.2 percent CAGR), India ($3.3 billion, 1.8 percent, 15.7 CAGR), Indonesia ($1.5 billion, 0.8 percent, 2.0 percent CAGR), Japan ($14.2 billion, 7.7 percent, -3.2 percent CAGR), Korea ($19.4 billion, 10.4 percent, 3.8 percent CAGR), Malaysia ($8.4 billion, 4.5 percent, 13 percent CAGR), Philippines ($1.4 billion, 0.7 percent, -2.7 percent CAGR), Taiwan-China ($4.9 billion, 2.6 percent, 5.4 percent CAGR), Thailand ($2.7 billion, 1.4 percent, -3.0 percent CAGR), and Vietnam ($1 billion, 0.5 percent, 21.6 percent CAGR).
/ EUROPE /
Europe, as a whole, which includes country markets within and outside the European Union, represented 21 percent of estimated retail sales within the global industry. WFDSA reported direct selling within in Europe continued to grow in 2021, posting a 2.8 percent increase over the previous year with estimated retail sales totaling $38.4 billion. The region’s CAGR was 2.0 percent.
An estimated 15.7 million independent representatives worked in direct selling throughout Europe—6.6 million inside the European Union and 9.1 million in the Rest of Europe. Wellness accounted for 31 percent of market sales, followed by Cosmetics and Personal Care at 23 percent, and Household Goods and Durables, 18 percent.
European Union
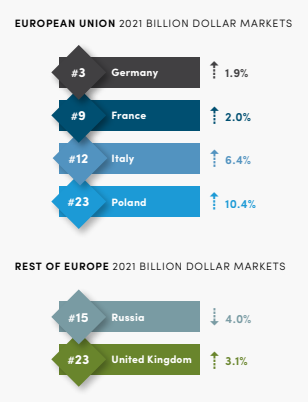
European Union country markets, of which the United Kingdom is no longer a part, reported $33.2 billion in estimated retail sales, an increase of 3.3 percent over 2020. France, Germany, Italy and Poland make up the EU Billion Dollar Markets.
Big news in the EU sub-region came from Poland, where a 10.4 percent increase resulted in nearly $1.3 billion in sales. Germany claimed 10.2 percent of global market and retained its number three rank on the 2021 Billion Dollar Markets list with $19 billion in estimated retail sales. Italy and France both rebounded from slumping sales in 2020, up 6.4 percent and 2.0 percent, respectively.
Rest of Europe
Segmented into the Rest of Europe, the United Kingdom and Russia are the only two Billion Dollar Markets. This sub-region generated $5.2 billion in estimated retail sales, an increase of 1.9 percent that maintained a 3.3 percent CAGR for 2021.
Rising pressure from the pandemic and economic drivers, which have only intensified this year due to international sanctions, the war in Ukraine and the announced exit of a legacy direct selling company from the market, contributed to a 4.0 percent sales drop in the Russian market in 2021. They reported just over $2 billion in estimated retail sales with a CAGR of -1.2 percent.
The United Kingdom experienced 3.1 percent growth and recorded $1.2 billion in sales in 2021. But perhaps the biggest news here was the U.K.’s 11.9 percent CAGR. After devastating CAGR’s hovering around -40 percent in 2018 and 2019, this country market surged back to report back-to-back years of 8.9 percent CAGR or higher.
As a whole, the Rest of Europe did not report product category sales data. U.K. data indicated Cosmetics and Personal Care comprised 46 percent of sales, while Household Goods and Durables and Wellness were 22 and 21 percent, respectively. Russia data reported a tie of 36 percent for Wellness and Cosmetics and Personal Care.
Hybrid Appeal Drives 2021 U.S. Growth
US DSA Bullish on Direct Selling’s Future
Despite the world gravitating toward eCommerce over the last decade and especially so during COVID times, direct selling remains at a competitive advantage in the United States because people aren’t willing to give up the personal touch completely.
Adolfo Franco, US DSA executive vice president, believes it’s this marriage that works in direct selling’s favor as consumers get increasingly comfortable making purchases outside traditional brick and mortar stores, but also desire the help of trusted advisors when they purchase cosmetics and health, wellness and nutritional products.

It’s this hybrid consumer appeal, along with an increasingly popular customer-centric, product-focused business model among U.S. direct selling companies, that drives annual industry growth.
In 2021, the United States, the world’s most lucrative global direct selling market, produced $42.7 billion in estimated retail sales, an increase of 6.4 percent year-over-year. The U.S. market decidedly ranks first of all global sales markets, according to the World Federation of Direct Selling Association’s 2021 statistics, released earlier this summer.
Looking back on 2021, the U.S. market was not immune to pandemic and economic-related issues that concerned the rest of the global market.
“The situation, particularly in China has been extremely problematic. The number of containers leaving Shanghai reduced by something like 60-70 percent coming into Los Angeles. Supply chain issues are a real serious concern and they impact anybody that’s in business, not just direct sellers. Shipping costs are through the roof, and that is a big concern too,” Franco shared.
However, one advantage that some direct sellers have over other non-direct selling companies is their ability to manufacture their own products. Some larger U.S. direct selling companies control—to some extent—much of the supply chain and, as such, some of the costs.
In spite of these challenges—of which so many still remain problematic, 2021 sales performance was good and indicates a healthy U.S. direct selling industry.
“There’s no question that it’s remarkably better compared to retail and others. So, I think that we’re very pleased with the direction that we are going,” Franco said.
The U.S. sales forecast for 2021 was growth between 4 and 7 percent. They hit that mark at 6.7 percent. However, don’t confuse Franco as a Pollyanna voice. He realizes COVID spikes in sales were dramatic and will not be sustainable year-in and year-out, especially as the word “recession” looms over 2022.
But direct selling traditionally does well amid economic tumult, which historically brings more people to the ranks as direct sellers. So, it’s a question of taking 2021 growth and bringing it to a level which remains healthy, then moving forward through this year and next.
“We are absolutely bullish on direct selling. We think the overall ingredients for direct selling in this economic climate are favorable and favor us,” Franco shared.
Zoom Calls Increase Dialogue
Clarity—that’s the goal of most data collection projects, and especially so of WFDSA’s annual global sales report that compiles statistics from direct selling associations the world over to summarize the strength of the industry in any given year.
It’s not surprising that a project this size faces many challenges. There are logistical and cultural hurdles associated with posing questions in readily understood formats and using sufficiently defined and translatable terminology, so that collected data represents the same things in all markets.
“When you ask a question of companies, you do need to make sure that you ask wide and broad types of questions. There are a number of terminologies that can be used if you have a direct customer, for instance, and it might not be perceived as what they determine that to be and what we’re defining as a direct customer,” Garth Wyllie, WFDSA Chair of the Association Services Committee, explained.
But it’s the matter of context that poses the greatest challenge for those wanting clarity about global, regional and country market performance. Admittedly, WFDSA data collection is not meant to dive deep the way individual companies might.
“We only get to see the end results, not every nuance or minutiae of what created these end results,” shared Josephine Mills, WFDSA’s Global Research Subcommittee Co-Chair.
“So, we have to try to interpret what we’re seeing in the data by also looking at what happened in the external environment to help provide context,” said Tim Sanson, WFDSA’s Global Research Subcommittee Co-Chair.
Zoom calls opened new lines of communication for the subcommittee in 2020, as they connected “face-to-face” with far-flung DSAs who could provide much needed context for what was happening on the ground in country markets.
In 2021, WFDSA increased their dialog with DSAs using Zoom, and Mills said, “They seem to be a lot more comfortable with us doing this. They are learning from us. We are learning from them. And it will only improve the process along the way.”
Depleted inventories, supply chain pressures and even government restrictions on the manufacture of non-essential products affected many countries, Tamuna Gabilaia, WFDSA executive director/COO, shared.
“In the beginning of 2021, we were still trying to find our way with COVID and starting to roll out in most parts of the world. What we did find in our talks with regions, particularly Latin America, is that they were struggling with lockdowns and restrictions on what they could or could not sell, and actually getting products to or from manufacturers in those markets,” Wyllie said.
“Costs of shipping really escalated in 2021, and that hasn’t gone away,” Wyllie added.
Anecdotally, they learned there was a rush to get inventories back in stock as 2021 progressed but once markets started to open, field engagement arose as the next challenge.
“People had been locked down for a year and a half. They got a little distracted on the business,” Sanson said.
By spending a lot more time on Zoom calls with DSAs, WFDSA gained better clarity about the statistics and could provide better education and escalate support when necessary.
“We want to do that more…It’s much more valuable having a face-to-face conversation showing them how we interpret the data and what we’re seeing and being able to provide more context both ways around that,” Sanson explained.
Adaptive, Resilient, Flexible
Global direct selling responds in 2021
2021 was a dynamic time in direct selling and proved to be a good year for the global industry. Despite being another year influenced by the pandemic—producing deep lows in China, which compounded unrelated challenges from 2019 and caused ripples of strife throughout the Asia/Pacific Region—the global direct selling industry responded with adaptability, flexibility and resilience to move forward.
“We’ve gotten used to the situation with COVID. We’ve adapted to it better, and we’ve learned how to run really well in the COVID environment,” Josephine Mills, WFDSA’s Global Research Subcommittee Co-Chair, shared.
A big differentiator in adaptability in 2021 involved the distributors’ interface with their customers and the ability of markets to shift and transact remotely, rather than face-to-face. This largely applied to less developed, emerging markets in places like South Africa and Southeast Asia, where cash transactions and home delivery remained the norm.
But everywhere the resistance to eCommerce dissipated as technology curves were flattened and direct sellers faced few options during COVID, according to Tamuna Gabilaia, WFDSA executive director/COO. Then came the realization that they could reach even more people than before.
“The industry as a whole is very resilient and adaptive, has changed in terms of technology and technology use and was ready to grow even with all the challenges they were facing,” Garth Wyllie, WFDSA chair of the Association Services Committee, said.
Some markets swung high resulting in a significant shuffling of DSN’s Billion Dollar Market List. Tim Sanson, WFDSA’s Global Research Subcommittee Co-Chair, says, “It’s hard to pinpoint whether that’s stable growth or movement of countries up and down simply because of the difference in the dynamics from market to market.”
Regardless, he felt that, “Overall the industry is strong. I’m not sure how many industries showed growth during that period, but the overall results say a lot.”
About the Research
This ANNUAL GLOBAL DATA COLLECTION is an effort initiated and funded under the management of the World Federation of Direct Selling Associations (WFDSA) in collaboration with its local member direct selling associations and their member companies around the world, for the benefit of the DSAs and the global direct selling industry.
Compiled annually, this is a collection of individual market data in local currency figures, which are converted into U.S. dollars using current year constant dollar exchange rates to eliminate the impact of currency fluctuation. All statistics are based on estimated retail sales and in some instances may be restated using actual sales data as they become available. Statistics for some markets represent direct selling association member companies only and not the entire industry in that country. Other statistics are WFDSA research estimates.
From the September 2022 issue of Direct Selling News magazine.


